Vaadin SwingBridge is a solution that allows you to run Swing apps in the web browser just by adding your app jars in the Vaadin skeleton app. I got a task to measure the memory consumption since we were getting many requests from customers related to that. So, I set out to build a test harness that could be used to measure SwingBridge and compared that to a popular alternative, Webswing.
This blog post is a detailed worklog, aimed to help developers to test their Swing apps memory usage with SwingBridge and to avoid some of the pitfalls we found during the process. The short version is that we were able to fit 38 users in a 4 GB box, all running the JOSM application and performing a predetermined task.
Counting users instead of megabytes
My initial thought was to measure memory per user, but testing it got complicated right away.
Per-user memory isn't a stable number, and it goes wrong differently depending on the architecture. When each session is its own operating-system process, those processes share pages, so adding up their resident memory charges them for memory that doesn't exist. When every session lives in one process, there's nothing per-session to read. Neither way scales linearly with users. I wrote a correction for the shared pages, and the correction needed its own correction.
So I deleted that test. You don't rent a cloud box by the megabyte. You pick a size and you find out how far it goes. That became the test: fix the memory budget, let each product tune itself, and count the users that still work. Then I don't have to do the accounting at all.
Why the rig is two machines
A real browser costs more memory than the session it's driving. Roughly 1.1 GB each, in my runs. Put the browsers on the box under test and you're mostly measuring your own test.
So the rig is two machines, plus a control box that starts both over SSH and measures nothing. Here's my test lab setup:
| Load generator | Server under test | |
|---|---|---|
| Hardware | 14 vCPU, 108 GB, swap off | bare metal, 16C/32T, 30.5 GB |
| Runs | one real Chromium per user, about 1.1 GB each | the whole product process tree |
| Constraint | 54 GB RAM disk for browser temporary files | cgroup, MemoryMax set to the budget, MemorySwapMax set to 0, OOMPolicy set to continue |
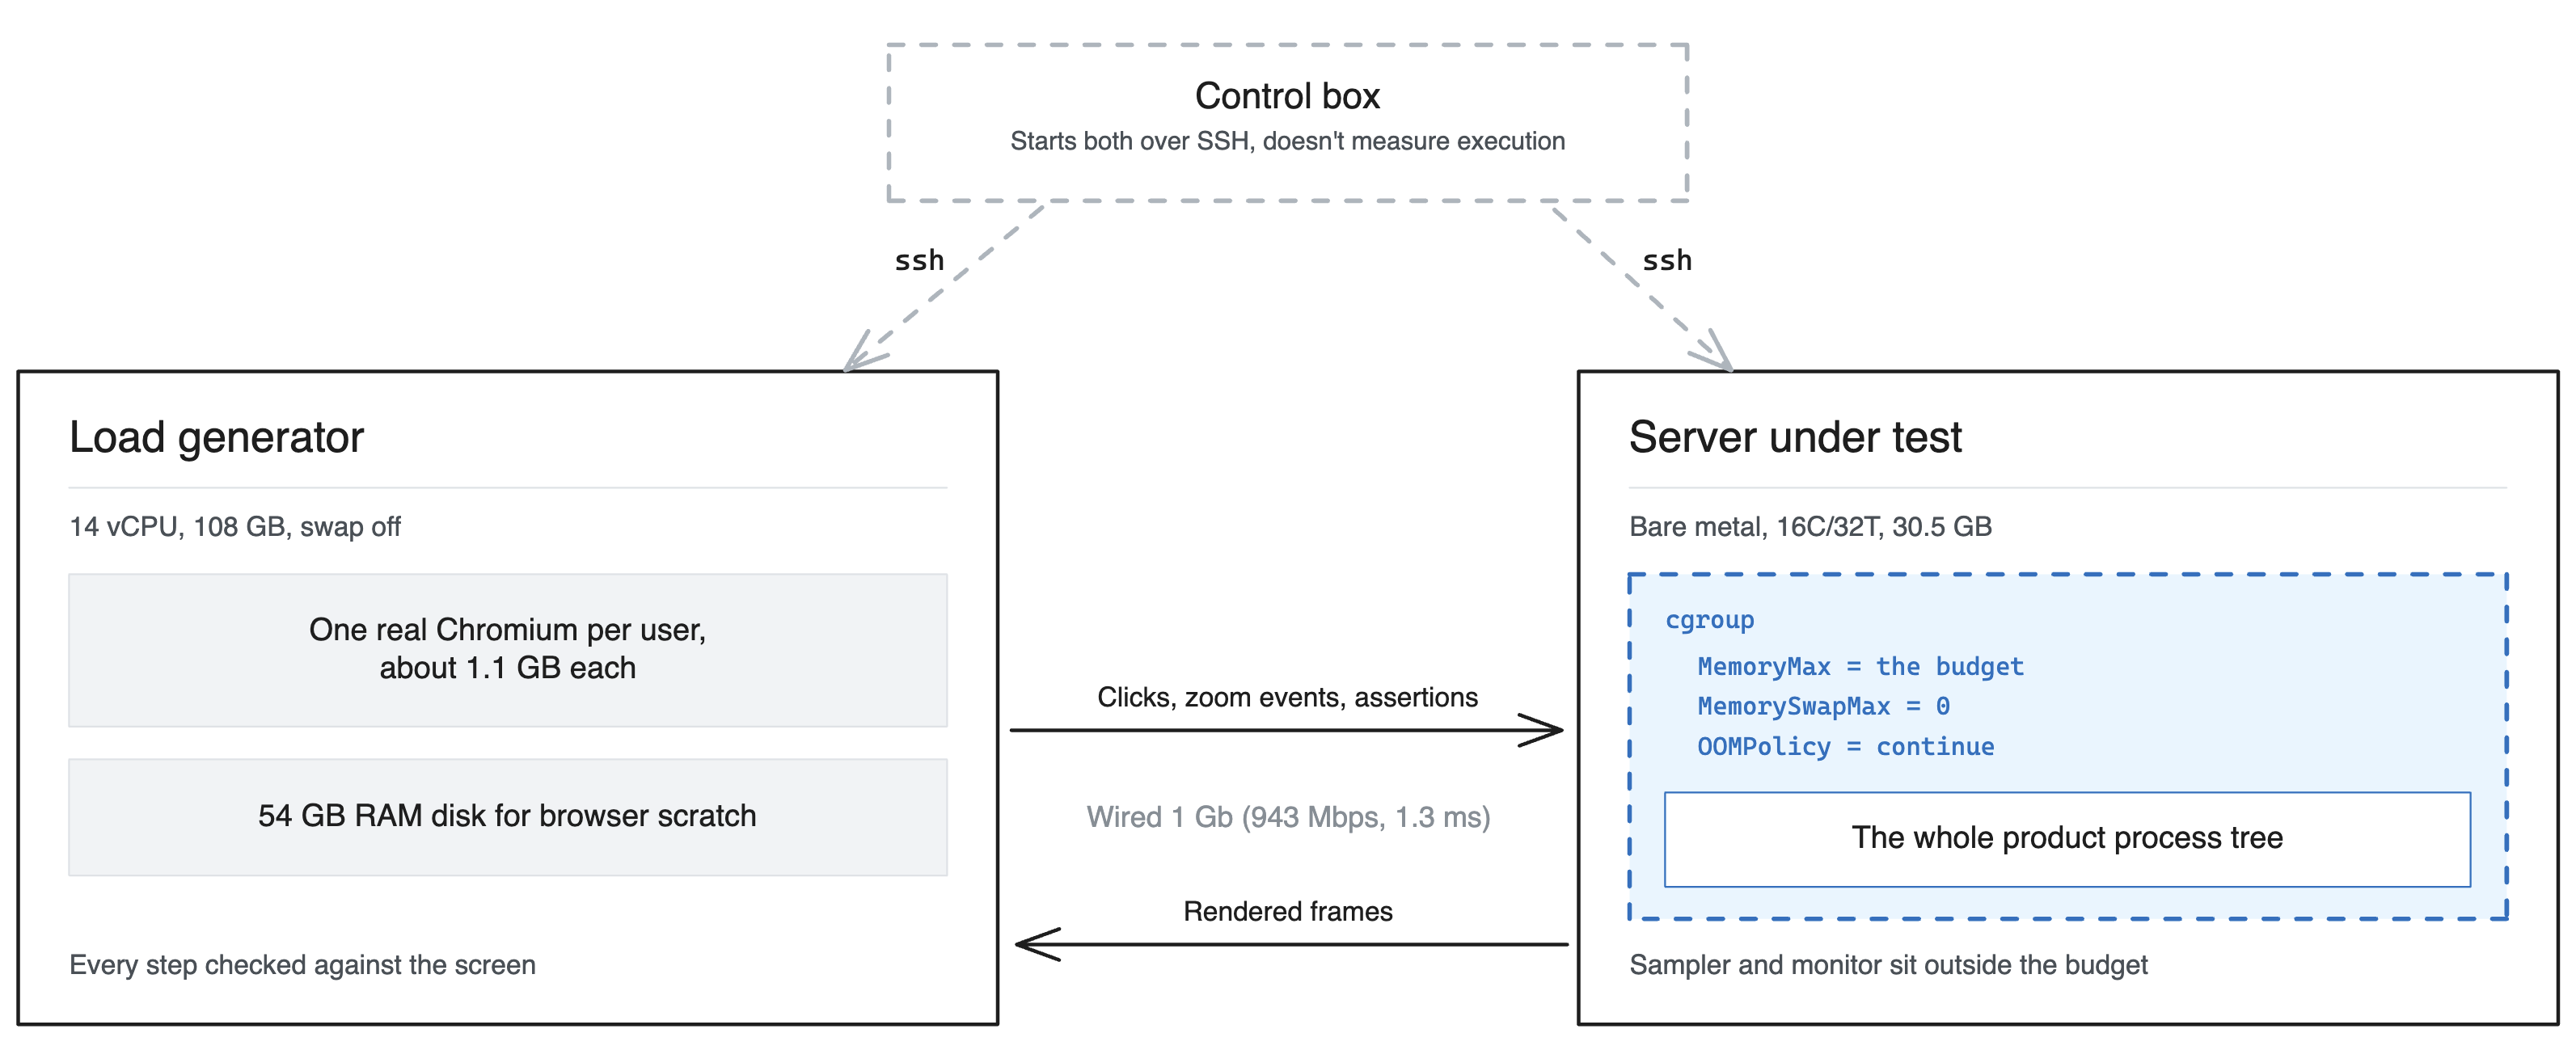
Figure 1: The measured boundary. Only the product's process tree runs inside the cgroup. The browsers, the sampler, the monitor and the control box all sit outside it. Three of the eight checks below exist to keep them there.
The link between them is wired gigabit ethernet, measured at 943 Mbps and 1.3 ms. Only the server box is measured and every memory figure here is binary. A 4 GB budget means MemoryMax=4096M.
Eight checks in the harness, and what each one prevents
Most of the time went into making sure that a wrong number won't go unnoticed. Each of these exists because the obvious alternative fails quietly, and most of them had already fooled me.
1. The budget is a kernel wall and swap is off. The whole process tree runs in a systemd scope with a hard cap and no swap. With swap on, a server that starts swapping stays technically alive while serving nobody, and the run records it as a success.
2. The build tool and my own instruments stay outside the budget. I capture the real server command and launch it directly inside the scope. The sampler and the monitor run outside it. Before I did this, the product was charged for 943 MB of Maven. That was measured sitting next to an 869 MB server, so it wasn't a rounding error.
3. Browsers live on the second machine. The first symptom of getting this wrong is subtle: the server's memory readings stop rising as you add users. Local browsers compete for the same RAM, the kernel starts reclaiming pages from the process you're measuring, and you get a nice flat graph that is really just memory being taken back.
4. Every step is checked against the screen. Each user does the same seven steps on a map: select, select, deselect, zoom in three notches, zoom back out, hide a layer, restore it. Every step is verified, and both zoom steps are checked to the exact scale. Without that you count sessions that aren't working. In an earlier round Webswing answered HTTP 200 on every health probe it ever served, including at 39 times its normal latency.
5. Peaks come from continuous sampling, not from a reading at the end. Read the process group after teardown and every counter returns its default, so you get a clean 0 MB for every cell you ever measured. A zero looks exactly like a real measurement of zero.
6. Error counts are deltas against a baseline. Out-of-memory errors are counted as the difference from a reading taken before the run starts. A product whose log survives restarts will otherwise hand you the same total in every cell. I had five heap sizes reporting an identical error count before I noticed the number never changed.
7. The browsers' temporary files live in RAM, and the run refuses to start unless there's room for every user it will add. Chromium writes 260 to 540 MB per user into them, then deletes them while it still has them open, so the space stays taken even though the files are gone from the listing. df sees that space and du doesn't, so the load machine's disk fills up with nothing to show for it and the ramp just stops. No error in any log, and from the outside you can't tell it apart from a capacity ceiling on the server.
8. Sample faster than the thing you're watching. Network and queue depth go into a once-per-second log with retransmission counts beside them. A transient that occupies a fraction of a percent of the run otherwise shows up as one large maximum, and a maximum can't tell you whether you're looking at a standing condition or a single spike.
Both sides tuned, and what tuning is worth
Heap size is the setting that moves the answer most, so I didn't want to pick it by hand. I swept it on both products at a 4 GB budget and reported each one at whatever actually served the most users. The run counts below are eligible runs, meaning the cell produced a verdict.
| Product | Heap | Users | Eligible runs | Note |
|---|---|---|---|---|
| SwingBridge | 1 GB | 16 | 1 | 58 Java out-of-memory errors |
| 1500 MB | 23 | 1 | still starved | |
| 2 GB | 32 | 1 | ||
| 2500 MB | 38 | 6 | published | |
| 2560 MB | 39 | 6 | survives, but 65 MB away from death | |
| 2625 MB | 39 | 1 | server killed, rejected | |
| 2750 MB | 41 | 1 | server killed, rejected | |
| 3500 MB | 29 | 1 | collector structures crowd out users | |
| Webswing | 64 MB | does not run | 1 | session dies out of memory |
| 80 MB | 9 | 1 | the floor | |
| 96 MB | 10 | 5 | published | |
| 112 MB | 10 | 1 | ||
| 128 MB | 9 | 1 | ||
| 144 MB | 8 | 1 | ||
| 192 MB | 8 | 2 | ||
| 256 MB | 8 | 2 | flat from here up |
SwingBridge's count moves 2.4× across that sweep, from 16 users to 38. JVM per user approach does not vary that much, it is only about picking the correct setting to max out available budget.
I publish 96 MB because it's bracketed: 80 MB below it and 128 MB above it each fit one fewer. 112 MB matches it at ten, so the top of the band is two settings wide and 96 MB is the lower end of it. Default sessions started at an inherited 512 MB that nobody had justified. It would charge 6.4× the heap of the actual need, once per session, in every single cell. So I swept downward until it stopped running: 80 MB works, 64 MB doesn't.
Above 2500 MB the curve stops behaving. 2625 MB and 2750 MB both reach more users and are then killed by the kernel, so there's no headroom up there, just a wall. 2560 MB is the one exception, and I come back to it below.
The bug that was making Webswing look worse
Webswing's 4 GB figure was 9 for most of this project. It's 10 because I found a fault in my own harness.
systemd's default OOM policy tears down the entire scope when the kernel kills one process in it. For a product that shares one JVM that's fine, because there's only one process to lose and losing it ends the run anyway. For a product that gives every user their own process it isn't fine at all: one dead session was taking down the whole server and ending the ramp, and I was recording the result as the ceiling. With SwingBridge there's a single process, so the policy had nothing to do.
The scope is now created with OOMPolicy=continue, so the kernel can take one session process and the rest keep serving. Webswing's number went up by one, and all five eligible runs at 96 MB now return exactly 10.
I also lost four runs at that same setting to Webswing's own log rotation, which left my driver with no verdict to report. Four cells, a whole evening, gone to somebody else's logrotate config. That log is now archived at the start of every cell.
Both bugs were mine, and I found both of them late.
Where the memory actually goes
Ten sessions at 96 MB is 960 MB of heap. The budget is 4 GB and it fills up. I stopped guessing about the rest and measured it, first per process and then inside a single JVM.
| SwingBridge | Webswing | |
|---|---|---|
| The server itself, before any user connects | 314 MB | 332 MB |
| Cost of one more user | 96 MB | 373 MB |
| One user's whole share of the box | 108 MB | 410 MB |
JVM's memory allocation is not 100% deterministic. Run twice, you measure 2 different very close numbers. It is safe to consider 332 MB per user is the minimum since admin is also a user.
The first row is the part I didn't expect. At rest, with nobody connected, the two servers cost about the same. So the difference is in the per-user cost, not in the server. That's where the 38 against 10 comes from.
The bottom row is just the budget divided by the users who fit, so it adds nothing the two rows above it don't already carry. The middle row is the marginal cost of one more user, and it's the one worth doing arithmetic with. On the Webswing side it closes cleanly: 332 plus ten lots of 373 is 4062 MB, and the 34 MB left over is a tenth of a session.
On the SwingBridge side it doesn't close, and I think that's the more interesting result. 314 plus 38 lots of 96 is 3962 MB, which leaves 134 MB unused in a 4 GB budget. That's about one and a half more users' worth. The model says 39 and the box gave me 38. The marginal cost of a user isn't the whole story near the wall, because the garbage collector also needs room to work, and that last 134 MB is what it's using. At 2560 MB, the 39th user does fit, but it's only 65 MB away from OOM death.
Then I ran native memory tracking inside one Webswing session started with -Xmx80m, which is the heap the 2 GB budget publishes and not the 96 MB above.
| Category | Committed | Share |
|---|---|---|
| Garbage collector structures | 81.2 MB | 26% |
Java heap, the -Xmx80m I asked for |
80.0 MB | 25% |
| Code cache | 35.4 MB | 11% |
| Symbol table | 17.6 MB | 6% |
| Arena chunks | 14.8 MB | 5% |
| Thread stacks | 11.7 MB | 4% |
| Class metadata | 9.0 MB | 3% |
| Everything else, individually smaller | 64.8 MB | 21% |
| Total | 315 MB |
The shares are rounded and add up to 101. I sampled four sessions and they all landed between 305 and 322 MB, so this split is probably representative and not a lucky one.
Three numbers in this post describe what a Webswing user costs, and they have three different denominators. 315 MB is what one JVM commits to itself. 373 MB is what one more session costs the machine at 4 GB. 410 MB is what a user works out to once the server's own fixed cost is spread across the ten that fit. None of them is wrong and none of them is the same quantity.
The heap I asked for is a quarter of what the session commits. The other three quarters are the price of starting a JVM at all, and that bill arrives once per user. 35 MB of it is compiled code, so with one JVM per person the same application methods get profiled and compiled again for every user, into that user's own code cache, producing one more copy of identical machine code.
I can't explain one row. 81.2 MB of collector structures to manage an 80 MB heap is far more than the sizing fractions in the documentation predict. The column is committed and not reserved, and the 35 MB code cache supports that reading, because a reserved column would show the code cache near its 240 MB default. So the number is real. I don't know why it's that big.
Why the heap setting does almost nothing on one side
That table is the reason the two sweeps behave so differently.
Per user, the heap is most of what a SwingBridge user costs and a quarter of what a Webswing session commits. Shrinking the Webswing heap doesn't shrink the collector structures, the code cache, the symbol table or the thread stacks around it, so that count barely moves however you set it. SwingBridge's count moves 2.4×, because there the heap is the part that matters.
It also explains why 3500 MB makes SwingBridge worse. Past some point SwingBridge's own collector structures grow faster than the extra heap buys room, and it fits fewer users than at 2500 MB.
How much the number moves between runs
Not every cell is a single run. The ones that matter have several.
The published 4 GB setting has six runs behind it: 34, 37, 38, 38, 39, 39. The 34 is a real outlier: at 35 users one user's zoom landed on the wrong scale, x2500 where the step asserts x0.1250. It took 784 ms and the map redrew, so nothing was slow. However, the assertion caught a step that hadn't happened yet. I kept it anyway. With it or without it the median is 38, and that's the number I publish.
2560 MB also has six runs: 38, 39, 39, 39, 40, 41. That's a tighter spread and its worst run equals the published figure. I didn't publish it. 2560 MB leaves only 65 MB between the peak and the wall, and at 2625 MB and 2750 MB the server dies. Sitting that close to a cliff for one extra user isn't a setting I'd put in front of a customer. You can disagree with that, and the counter-argument is decent: 2560 MB never actually died in six runs, and six runs is what I have.
Across all three budgets, expect roughly one user of movement in either direction on a repeat run. Anything you build on these figures should tolerate that, and a count derived by dividing one of these numbers by another is a floor, not an exact multiple.
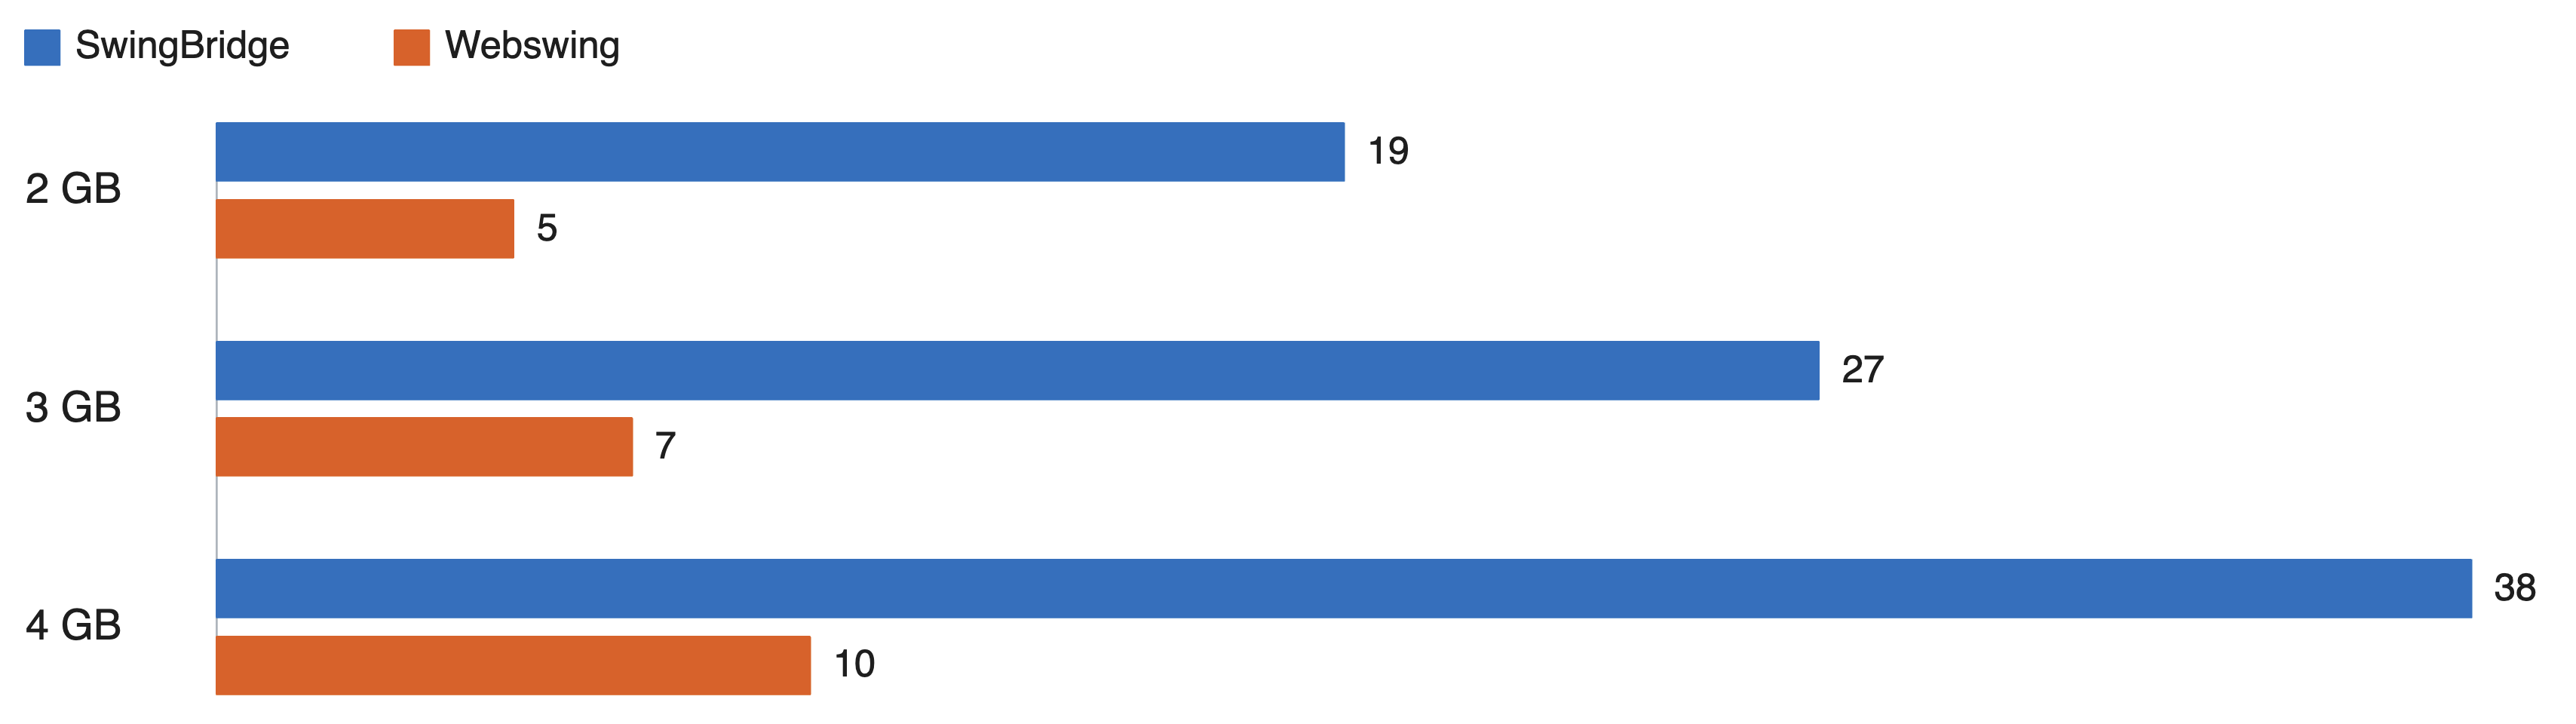
Figure 2: Users served at each budget, each product at its own best heap setting for that budget. Every user counted finished the same seven-step task.
The numbers, once more
Three memory budgets, enforced on the whole process tree and on nothing else, both products at their own best setting, every user completing the asserted task.
| Budget | SwingBridge | Webswing | Ratio |
|---|---|---|---|
| 2 GB | 19 | 5 | 3.80× |
| 3 GB | 27 | 7 | 3.86× |
| 4 GB | 38 | 10 | 3.80× |
The ratio is flat at about 3.8× across all three. What grows with the budget is the gap in absolute users, and not the multiple.
While it's tempting to extrapolate from these three measurements out to 6 GB and 8 GB, those cells haven't been run.
What we limited, and what we didn't
We limited memory. We did not limit CPU. Both products ran on a machine with cores to spare, so these figures are a memory ceiling and nothing else. If your deployment runs out of processing power before it runs out of RAM, this benchmark doesn't describe you, and you should run a different one.
What this doesn't cover
Bandwidth is outside this scope and it's a fair question. There's work in progress on how frames are encoded, and it's the next thing I want to measure.
With one JVM, everyone shares the same process. A guest application that calls System.exit takes the other users with it. A process per session doesn't have that problem, and it's a real advantage of that design. I didn't measure it, and a comparison that counts only memory is biased toward SwingBridge by leaving it out.
My own opinion, having now spent a few weeks inside both shapes: the per-session JVM buys isolation that's genuinely hard to get any other way, and on this workload it costs about four users out of every five. If the Swing application is one your own team wrote and maintains, I think that's a bad trade. If you're hosting something you didn't write and can't fix, it may be the only trade available. That's a judgment about your codebase more than about the two products.
Latency under load, license cost, and behavior over weeks are all real questions and all outside this one.
Every number here comes from one machine and one workload: a bare-metal 16-core box running JOSM, a real OpenStreetMap editor, at 1920×1080. Your application isn't that application. The advantage also narrows as the guest application gets bigger, because a larger application makes the per-JVM overhead a smaller share of the total. Measuring a real editor instead of a demo was deliberate for that reason.
Why I stopped at 4 GB
2 GB, 3 GB and 4 GB are what I can report today. The generator is the constraint. Every counted user is a real browser doing real work at about 1.1 GB, an order of magnitude more than the session it's exercising. At 4 GB we fit 38 users, so I have to size a generator for roughly twice that many browsers before I can find out what 8 GB holds, which is close to 100 GB of RAM spent before the first measurement is taken.
It also has to be sized before the run, not discovered during it. A generator that runs short truncates the SwingBridge count while Webswing's is still a genuine server ceiling, and a ratio built from one truncated number and one real one understates SwingBridge. So I'm waiting for a bigger generator before I report anything above 4 GB.
Run it yourself
Re-run this rather than trusting me. The harness and the full run configuration are here: github.com/vaadin/swingbridge-sizing-kit-dev
It has the cgroup setup, the step assertions, the sweep driver and the sampling in it. Point it at your own Swing application and you'll get your own number, which is the one that decides your server bill.
Watch the session
.png?width=2400&height=1254&name=V1_1200x627%20(2).png) SwingBridge 1.3 shipped on 9 September. Miikka Andersson and I talked through where the memory went, how to size and tune your own deployment, and what's in focus for 1.4.
SwingBridge 1.3 shipped on 9 September. Miikka Andersson and I talked through where the memory went, how to size and tune your own deployment, and what's in focus for 1.4.